Game winner prediction
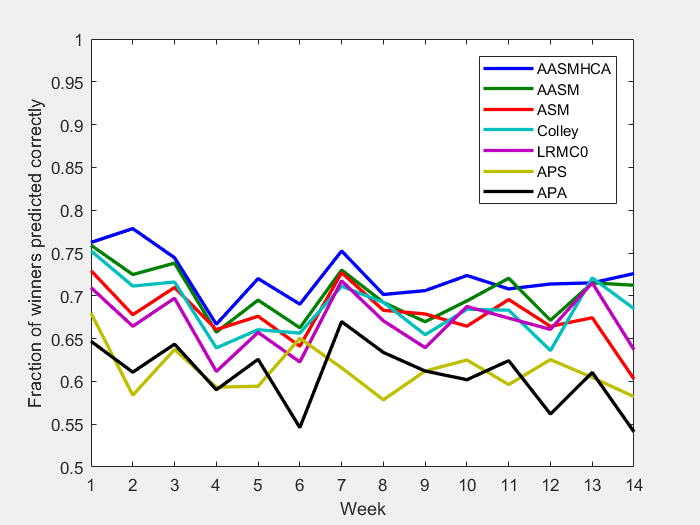
| # winners correctly predicted | ||||||||
| Rankings date | # games | AASM+HCA | AASM | ASM | Colley | LRMC0 | APS | APA |
| 12/16/12 | 303 | 231 (76.2%) | 230 (75.9%) | 221 (72.9%) | 228 (75.2%) | 215 (71.0%) | 206 (68.0%) | 196 (64.7%) |
| 12/23/12 | 149 | 116 (77.9%) | 108 (72.5%) | 101 (67.8%) | 106 (71.1%) | 99 (66.4%) | 87 (58.4%) | 91 (61.1%) |
| 12/30/12 | 317 | 236 (74.4%) | 234 (73.8%) | 225 (71.0%) | 227 (71.6%) | 221 (69.7%) | 202 (63.7%) | 204 (64.4%) |
| 01/06/13 | 327 | 218 (66.7%) | 215 (65.7%) | 216 (66.1%) | 209 (63.9%) | 200 (61.2%) | 194 (59.3%) | 193 (59.0%) |
| 01/13/13 | 318 | 229 (72.0%) | 221 (69.5%) | 215 (67.6%) | 210 (66.0%) | 209 (65.7%) | 189 (59.4%) | 199 (62.6%) |
| 01/20/13 | 326 | 225 (69.0%) | 216 (66.3%) | 209 (64.1%) | 214 (65.6%) | 203 (62.3%) | 212 (65.0%) | 178 (54.6%) |
| 01/27/13 | 315 | 237 (75.2%) | 230 (73.0%) | 229 (72.7%) | 224 (71.1%) | 226 (71.7%) | 194 (61.6%) | 211 (67.0%) |
| 02/03/13 | 325 | 228 (70.2%) | 225 (69.2%) | 222 (68.3%) | 225 (69.2%) | 218 (67.1%) | 188 (57.8%) | 206 (63.4%) |
| 02/10/13 | 330 | 233 (70.6%) | 221 (67.0%) | 224 (67.9%) | 216 (65.5%) | 211 (63.9%) | 202 (61.2%) | 202 (61.2%) |
| 02/17/13 | 304 | 220 (72.4%) | 211 (69.4%) | 202 (66.4%) | 208 (68.4%) | 209 (68.8%) | 190 (62.5%) | 183 (60.2%) |
| 02/24/13 | 322 | 228 (70.8%) | 232 (72.0%) | 224 (69.6%) | 220 (68.3%) | 217 (67.4%) | 192 (59.6%) | 201 (62.4%) |
| 03/03/13 | 283 | 202 (71.4%) | 190 (67.1%) | 188 (66.4%) | 180 (63.6%) | 187 (66.1%) | 177 (62.5%) | 159 (56.2%) |
| 03/10/13 | 172 | 123 (71.5%) | 123 (71.5%) | 116 (67.4%) | 124 (72.1%) | 123 (71.5%) | 104 (60.5%) | 105 (61.0%) |
| Postseason | 146 | 106 (72.6%) | 104 (71.2%) | 88 (60.3%) | 100 (68.5%) | 93 (63.7%) | 85 (58.2%) | 79 (54.1%) |
| Total | 3937 | 2832 (71.9%) | 2760 (70.1%) | 2680 (68.1%) | 2691 (68.4%) | 2631 (66.8%) | 2422 (61.5%) | 2407 (61.1%) |
| Expected | 3937 | 3066 (77.9%) | 3020 (76.7%) | 2984 (75.8%) | N/A | N/A | N/A | N/A |
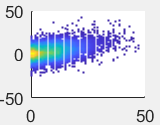
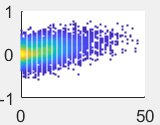
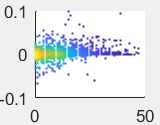
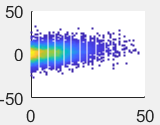
Score margin prediction
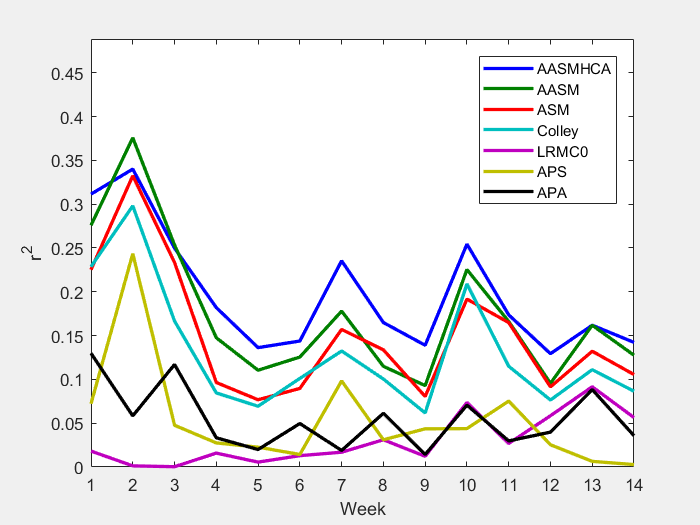
| Squared correlation coefficient | ||||||||
| Rankings date | # games | AASM+HCA | AASM | ASM | Colley | LRMC0 | APS | APA |
| 12/16/12 | 303 | 0.311 | 0.276 | 0.225 | 0.229 | 0.018 | 0.072 | 0.130 |
| 12/23/12 | 149 | 0.340 | 0.376 | 0.332 | 0.298 | 0.001 | 0.243 | 0.058 |
| 12/30/12 | 317 | 0.250 | 0.253 | 0.233 | 0.167 | 0.000 | 0.048 | 0.117 |
| 01/06/13 | 327 | 0.182 | 0.148 | 0.096 | 0.085 | 0.016 | 0.027 | 0.033 |
| 01/13/13 | 318 | 0.136 | 0.110 | 0.077 | 0.069 | 0.006 | 0.023 | 0.020 |
| 01/20/13 | 326 | 0.144 | 0.126 | 0.090 | 0.101 | 0.013 | 0.014 | 0.050 |
| 01/27/13 | 315 | 0.235 | 0.178 | 0.157 | 0.132 | 0.017 | 0.098 | 0.019 |
| 02/03/13 | 325 | 0.165 | 0.115 | 0.134 | 0.100 | 0.031 | 0.031 | 0.061 |
| 02/10/13 | 330 | 0.139 | 0.093 | 0.080 | 0.062 | 0.012 | 0.044 | 0.014 |
| 02/17/13 | 304 | 0.254 | 0.225 | 0.192 | 0.209 | 0.074 | 0.044 | 0.071 |
| 02/24/13 | 322 | 0.174 | 0.166 | 0.165 | 0.115 | 0.027 | 0.075 | 0.030 |
| 03/03/13 | 283 | 0.129 | 0.096 | 0.091 | 0.076 | 0.059 | 0.025 | 0.040 |
| 03/10/13 | 172 | 0.162 | 0.162 | 0.132 | 0.111 | 0.092 | 0.006 | 0.088 |
| Postseason | 146 | 0.142 | 0.128 | 0.106 | 0.086 | 0.056 | 0.003 | 0.036 |
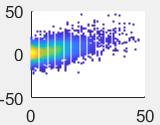
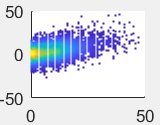
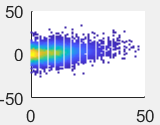
| Total | 3937 | 0.206 | 0.179 | 0.151 | 0.129 | 0.011 | 0.048 | 0.054 | Combined plot |
x:act. y:pred. |
 |
 |
 |
 |
 |
 |
 |