Game winner prediction
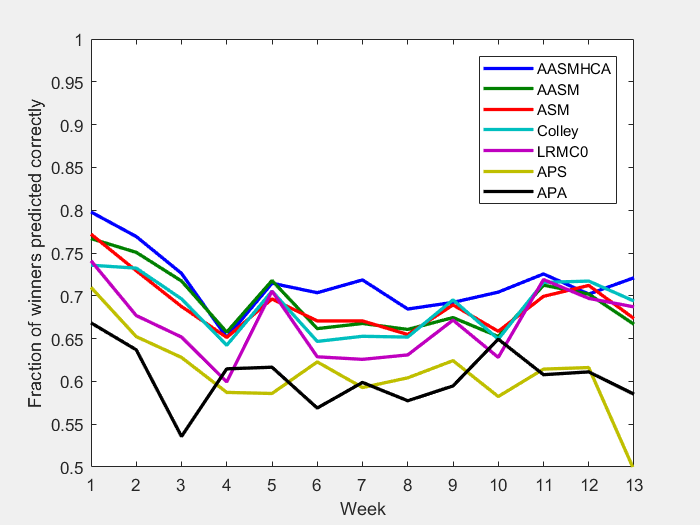
| # winners correctly predicted | ||||||||
| Rankings date | # games | AASM+HCA | AASM | ASM | Colley | LRMC0 | APS | APA |
| 12/20/15 | 193 | 154 (79.8%) | 148 (76.7%) | 149 (77.2%) | 142 (73.6%) | 143 (74.1%) | 137 (71.0%) | 129 (66.8%) |
| 12/27/15 | 325 | 250 (76.9%) | 244 (75.1%) | 237 (72.9%) | 238 (73.2%) | 220 (67.7%) | 212 (65.2%) | 207 (63.7%) |
| 01/03/16 | 336 | 244 (72.6%) | 241 (71.7%) | 231 (68.8%) | 234 (69.6%) | 219 (65.2%) | 211 (62.8%) | 180 (53.6%) |
| 01/10/16 | 327 | 213 (65.1%) | 215 (65.7%) | 213 (65.1%) | 210 (64.2%) | 196 (59.9%) | 192 (58.7%) | 201 (61.5%) |
| 01/17/16 | 326 | 233 (71.5%) | 234 (71.8%) | 227 (69.6%) | 230 (70.6%) | 230 (70.6%) | 191 (58.6%) | 201 (61.7%) |
| 01/24/16 | 334 | 235 (70.4%) | 221 (66.2%) | 224 (67.1%) | 216 (64.7%) | 210 (62.9%) | 208 (62.3%) | 190 (56.9%) |
| 01/31/16 | 334 | 240 (71.9%) | 223 (66.8%) | 224 (67.1%) | 218 (65.3%) | 209 (62.6%) | 198 (59.3%) | 200 (59.9%) |
| 02/07/16 | 336 | 230 (68.5%) | 222 (66.1%) | 220 (65.5%) | 219 (65.2%) | 212 (63.1%) | 203 (60.4%) | 194 (57.7%) |
| 02/14/16 | 338 | 234 (69.2%) | 228 (67.5%) | 233 (68.9%) | 235 (69.5%) | 227 (67.2%) | 211 (62.4%) | 201 (59.5%) |
| 02/21/16 | 328 | 231 (70.4%) | 214 (65.2%) | 216 (65.9%) | 213 (64.9%) | 206 (62.8%) | 191 (58.2%) | 213 (64.9%) |
| 02/28/16 | 306 | 222 (72.5%) | 218 (71.2%) | 214 (69.9%) | 219 (71.6%) | 220 (71.9%) | 188 (61.4%) | 186 (60.8%) |
| 03/06/16 | 198 | 139 (70.2%) | 139 (70.2%) | 141 (71.2%) | 142 (71.7%) | 138 (69.7%) | 122 (61.6%) | 121 (61.1%) |
| Postseason | 147 | 106 (72.1%) | 98 (66.7%) | 99 (67.3%) | 102 (69.4%) | 101 (68.7%) | 73 (49.7%) | 86 (58.5%) |
| Total | 3828 | 2731 (71.3%) | 2645 (69.1%) | 2628 (68.7%) | 2618 (68.4%) | 2531 (66.1%) | 2337 (61.1%) | 2309 (60.3%) |
| Expected | 3828 | 2963 (77.4%) | 2920 (76.3%) | 2877 (75.1%) | N/A | N/A | N/A | N/A |
Score margin prediction
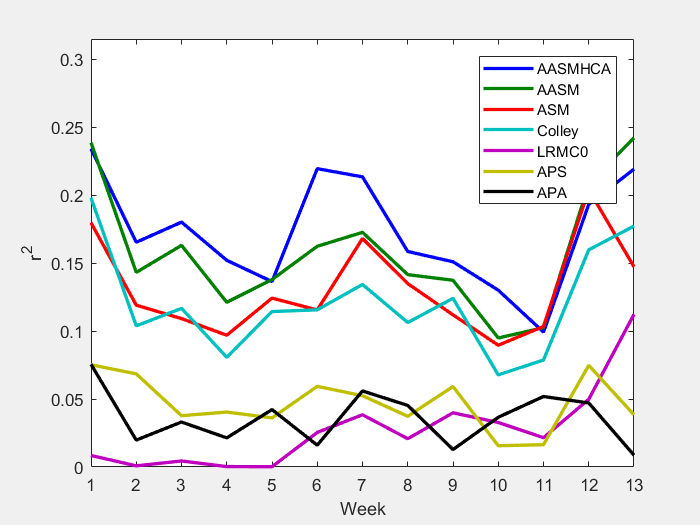
| Squared correlation coefficient | ||||||||
| Rankings date | # games | AASM+HCA | AASM | ASM | Colley | LRMC0 | APS | APA |
| 12/20/15 | 193 | 0.234 | 0.239 | 0.180 | 0.198 | 0.008 | 0.075 | 0.076 |
| 12/27/15 | 325 | 0.165 | 0.143 | 0.119 | 0.104 | 0.001 | 0.068 | 0.020 |
| 01/03/16 | 336 | 0.180 | 0.163 | 0.109 | 0.117 | 0.004 | 0.038 | 0.033 |
| 01/10/16 | 327 | 0.152 | 0.121 | 0.097 | 0.081 | 0.000 | 0.040 | 0.021 |
| 01/17/16 | 326 | 0.136 | 0.138 | 0.124 | 0.114 | 0.000 | 0.036 | 0.042 |
| 01/24/16 | 334 | 0.219 | 0.162 | 0.115 | 0.116 | 0.025 | 0.059 | 0.016 |
| 01/31/16 | 334 | 0.213 | 0.173 | 0.168 | 0.134 | 0.038 | 0.052 | 0.056 |
| 02/07/16 | 336 | 0.158 | 0.141 | 0.135 | 0.106 | 0.021 | 0.037 | 0.045 |
| 02/14/16 | 338 | 0.151 | 0.137 | 0.112 | 0.124 | 0.040 | 0.059 | 0.013 |
| 02/21/16 | 328 | 0.130 | 0.095 | 0.090 | 0.068 | 0.033 | 0.016 | 0.037 |
| 02/28/16 | 306 | 0.099 | 0.102 | 0.103 | 0.079 | 0.022 | 0.016 | 0.052 |
| 03/06/16 | 198 | 0.193 | 0.208 | 0.204 | 0.160 | 0.050 | 0.075 | 0.047 |
| Postseason | 147 | 0.219 | 0.242 | 0.147 | 0.177 | 0.112 | 0.038 | 0.009 |
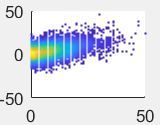
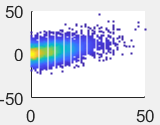
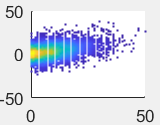
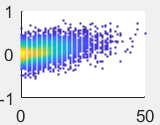
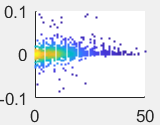
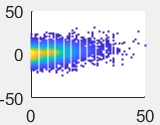
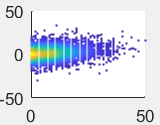
| Total | 3828 | 0.175 | 0.158 | 0.130 | 0.118 | 0.003 | 0.048 | 0.035 | Combined plot |
x:act. y:pred. |
 |
 |
 |
 |
 |
 |
 |